
One of the many maps made over the course of my time in London (apparently cloudy days inspire greyscale).
For most Londoners, January means short days and gray skies. For me, it also means the realization that I’m rapidly approaching the midway point of my Fulbright-National Geographic project on collecting and analyzing groups of Londoners’ personal geolocation and browser history data. In the past, I’ve used these posts as opportunities to ruminate on the high-level concepts informing my project, but this post will be treated a bit differently. Since I’m nearly halfway done, I thought it would be fitting to talk about three of the most important things I’ve discovered over the past four months spent working on this project.
Trust and Data
One of the first things I learned is the importance of trust and communication when it comes to working with people. I started this project knowing that I wanted to work directly with a group of people, collect their offline and online data, and see what that data would reveal about interactions with others and/or experiences within the city. This task revealed itself to be infinitely more complicated than I had assumed. Most long-term projects have an ambiguity that results from the distance between initial stated desires and final project outcomes. But working with data heightens that ambiguity because it’s not really clear what will emerge as important, relevant, or interesting until after you’ve started the data’s come in, which means that there’s a good chunk of time where you’re working hard but with no clue to what end.
My decision to do grassroots collection rather than use online data sets added an extra layer of difficulty that underscored the importance of access and trust. For the project to work, I needed to find people who would be willing to give me their own data. While seeking this out, I began to see just how much cultural baggage surrounds the topic of data collection, and to understand that for people to be comfortable with what I was asking, I had to make sure that I communicated clearly and often about what my intended personal objectives were.
Beyond that, I noticed a distinct trend: the higher the number of offline, in-person interactions I had with my participants, the easier it was for them to give me their data. Even now, I have collected about 70% of the data from my participants, and the breakdown for who I have and haven’t gotten it from can be plotted linearly based on the amount (and length) of in-person interactions I had with my respective participants. I’ve explored this idea in greater detail on my personal site, but the basic point is that it appears that successful direct data collection depends on trust, and for my project, trust is and was built upon numerous rich, in-person, interactions.
(Having said that, I’ve still got another round of data collection ahead of me, so I’m looking forward to the ability to verify this hypothesis by adjusting the measures that I use to collect data from my next group of participants.)
Offline Contextualizes Online
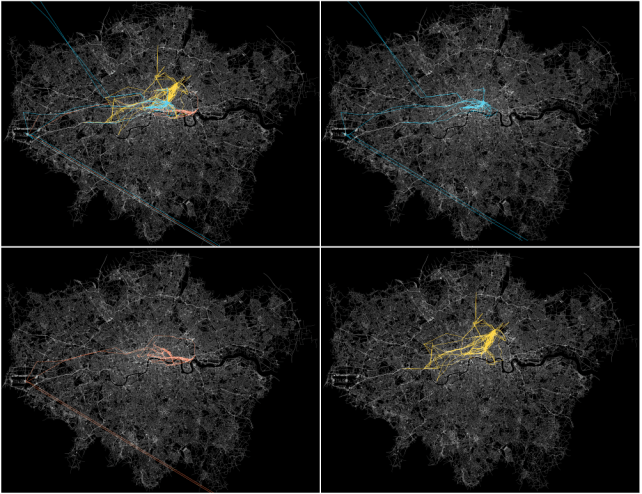
The data trails of the three participants in question, combined in the first image and displayed individually for the rest.
Now that it’s January, I’ve had the opportunity to give the data that I do have more than just a preliminary look-over. The results of these deeper examinations have actually changed the direction of my project, primarily because of something of which I've recently become aware: online data becomes interesting when situated within an already-existing offline context.
To better explain this, I’ll focus on the geolocation data that I received. I was able to map all of the places where my participants moved around the city, layer these travels on top of each other, and then visualize those travels (see above image). By animating the movement based on time, I could see where every person was at the same points in time over the course of a month.
However, a few of the participants I worked with happened to be friends with each other, and knowing that fact changed the interpretation of their data. Interesting things emerged merely through watching their data unfold. For instance, it’s clear which of the three spent more time with each other, at what points they split into different permutations, who consistently traveled the most to be with the others, and so on. In short, their combined data detail more than just where they’ve gone offline; they show the lived reality of their friendship as experienced over that duration of time. These data trails hint at a larger story that has to do with the qualitative aspects of their quantitative data. They show that when contextualized with offline realities, the numbers that make up our data can reveal broader things about our lives and relationships.
This realization has prompted a bit of a turn in my data. While I’m still focused on collecting geolocation and browser history data, I’ve shifted my focus to people who, though they may initially be strangers to me, are not strangers to one another. In particular, I’m examining the data of relationships. How do the data trails of three friends compare to those of partners who live in the same house, or to a mother and child, or to two people on the verge of beginning a relationship, and so on? We live in an increasingly networked world, and I am finding compelling the ways we have to examine how we interact with the people who matter most to us.
Browser Histories Matter

This figure abstractly represents what my online browsing looked like over the course of a month, with each circle representing a unique site and the links showing how I moved from one site to another. In my next post I'll dive more into this and include a labeled version, but for now I'll give one unsurprising spoiler: the node in the middle, with the most connections, is Google.
In my previous posts, I’ve spent inordinately more time talking about data broadly, and geolocation data specifically, than I have about the browser history data that I’ve also been collecting and working with. This is mainly for an obvious reason: while most people have an innate affinity for and understanding of maps, browsers are comparatively more difficult spaces to conceptualize, and it can be hard to comprehend what use they offer. So I’ve opted to begin with the area that makes sense to most, which has pushed my forays in geolocation data to the forefront.
But despite the fact that I haven’t written in-depth about them here on this site, I’ve spent much of my time in London looking into browser histories and what information they present (beyond fodder for advertisements). In the process, I’ve discovered the odd way in which browser histories support geolocation data. At the point at which geolocation data stops conveying important information, online computer browsing often jumps in to reveal other things (think about it: you might step into your office for several hours, but though you’ve stopped moving on a map, you’re still sitting in front of a computer screen, browsing to all sorts of digital places). To better handle this, I am in the process of creating a couple of code-based tools that do the work of breaking down and visualizing online browsing in a variety of ways. The image above is a rudimentary example of this, but my next post will present more of this work and expand in greater detail on the concept.
So what’s the general conclusion? After four months of research and work, I’ve seen in a myriad of ways that our on and offline interactions are inextricably tied to one another. Understanding one necessitates examining the other, and both should be treated as overlapping contexts. That realization has directly affected the rest of my project, and I’m excited to see how it continues to manifest itself in the five months ahead.
If you’re interested in more of this type of update, check out my project site, where I post bi-weekly progress updates. And as always, I’m also available on Twitter and my personal website. Cheers!